
Every federal contractor above the reporting threshold files a VETS-4212 report each year stating how many people it hired and how many of them were protected veterans. The Department of Labor publishes those filings but does not aggregate them. We did.
Read the headline number carefully. Veteran self-identification is voluntary. Every figure on this page therefore understates true veteran employment by an unknown margin — an employee who chooses not to disclose is invisible in the data. These are rates of recorded veteran hiring, not a census of veterans at work.
The typical employer is not close
The national figure of 2.97% is itself well under the 5.1% benchmark OFCCP sets for federal contractors. But an average is a poor description of what most employers do, because a small number of very large, genuinely veteran-friendly employers pull it upward.
The blunter measure: of 271,266 establishments that hired anyone at all, 208,500 — 77% — recorded no veteran hires whatsoever. Among employers large enough for a rate to mean something (25 or more hires), only 27.5% reached the benchmark.
That gap is the entire problem. It is not that employers are hostile to hiring veterans; it is that most have no pipeline to them.
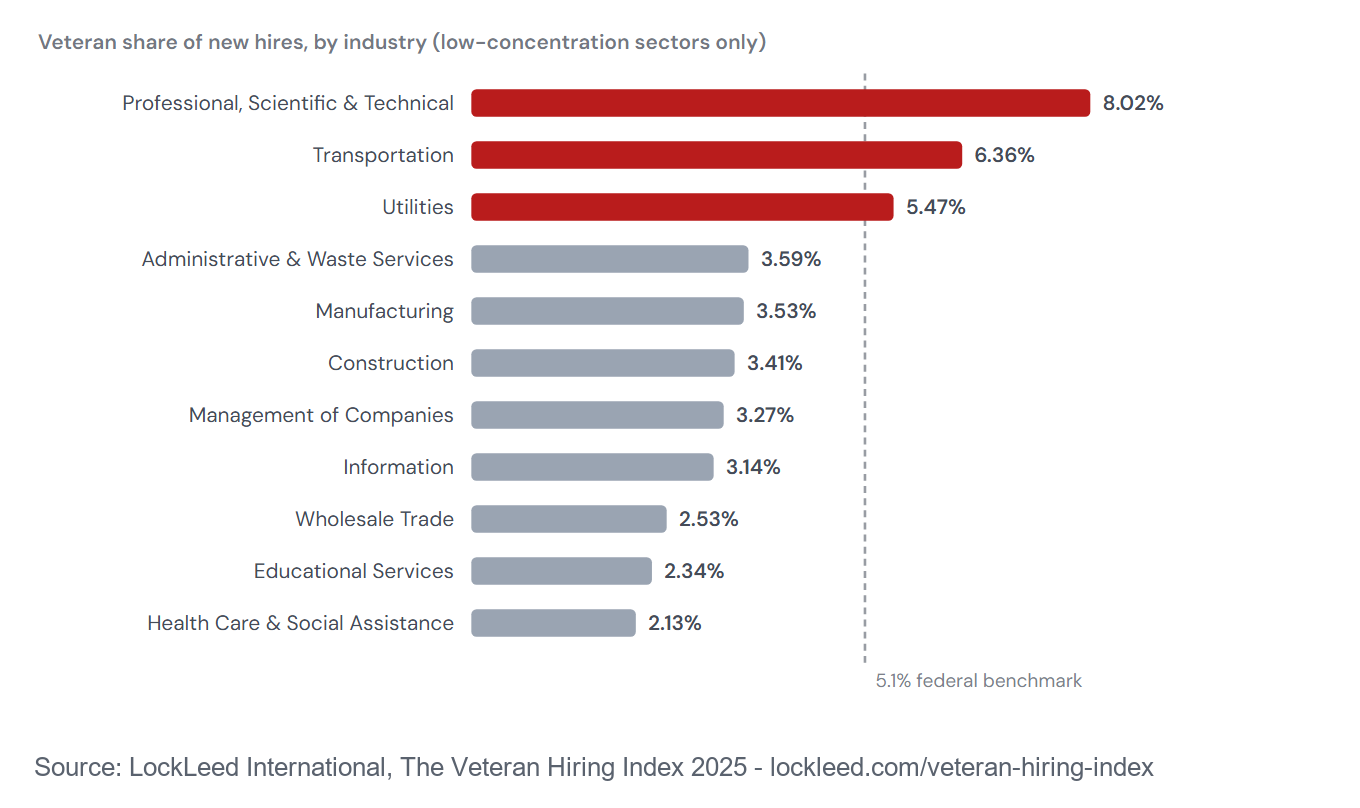
By industry
Two numbers are shown for each industry, and they disagree for a reason. The aggregate is all veteran hires divided by all hires — the industry total. The median establishment is the middle location, which is what a typical worksite in that industry actually looks like. Where the median is far below the aggregate, a handful of large employers are carrying the industry.
| Industry | Veteran share of new hires | Median establishment | New hires | Establishments |
|---|---|---|---|---|
| Professional, Scientific & Technical | 8.02% | 2.94% | 694,842 | 29,163 |
| Transportation | 6.36% | 3.70% | 207,617 | 6,573 |
| Utilities | 5.47% | 3.85% | 62,237 | 4,714 |
| Administrative & Waste Services | 3.59% | 1.96% | 747,153 | 20,218 |
| Manufacturing | 3.53% | 2.29% | 1,128,366 | 27,811 |
| Construction | 3.41% | 2.38% | 364,559 | 8,250 |
| Management of Companies | 3.27% | 0.52% | 122,100 | 4,039 |
| Information | 3.14% | 1.16% | 254,499 | 11,021 |
| Wholesale Trade | 2.53% | 1.37% | 291,720 | 14,401 |
| Educational Services | 2.34% | 1.54% | 268,513 | 1,613 |
| Health Care & Social Assistance | 2.13% | 0.61% | 905,964 | 33,138 |
Industries where a few filers dominate
These are reported for completeness but should not be read as industry norms. In each, the three largest filers account for more than 40% of all hires, so the figure describes those companies rather than the sector. Retail, for instance, is largely Amazon and CVS Health; warehousing is largely UPS and FedEx. They are excluded from the chart above.
| Industry | Veteran share of new hires | Median establishment | New hires | Establishments |
|---|---|---|---|---|
| Real Estate & Rental 53% concentrated | 3.97% | 1.57% | 74,060 | 8,030 |
| Other Services 43% concentrated | 2.74% | 0.00% | 59,673 | 3,904 |
| Retail Trade 80% concentrated | 1.69% | 0.93% | 1,450,267 | 32,807 |
| Warehousing & Postal 93% concentrated | 1.65% | 1.52% | 637,302 | 4,504 |
| Accommodation & Food Services 58% concentrated | 1.36% | 0.00% | 589,748 | 18,965 |
| Finance & Insurance 42% concentrated | 1.26% | 0.39% | 558,753 | 36,440 |
By job level
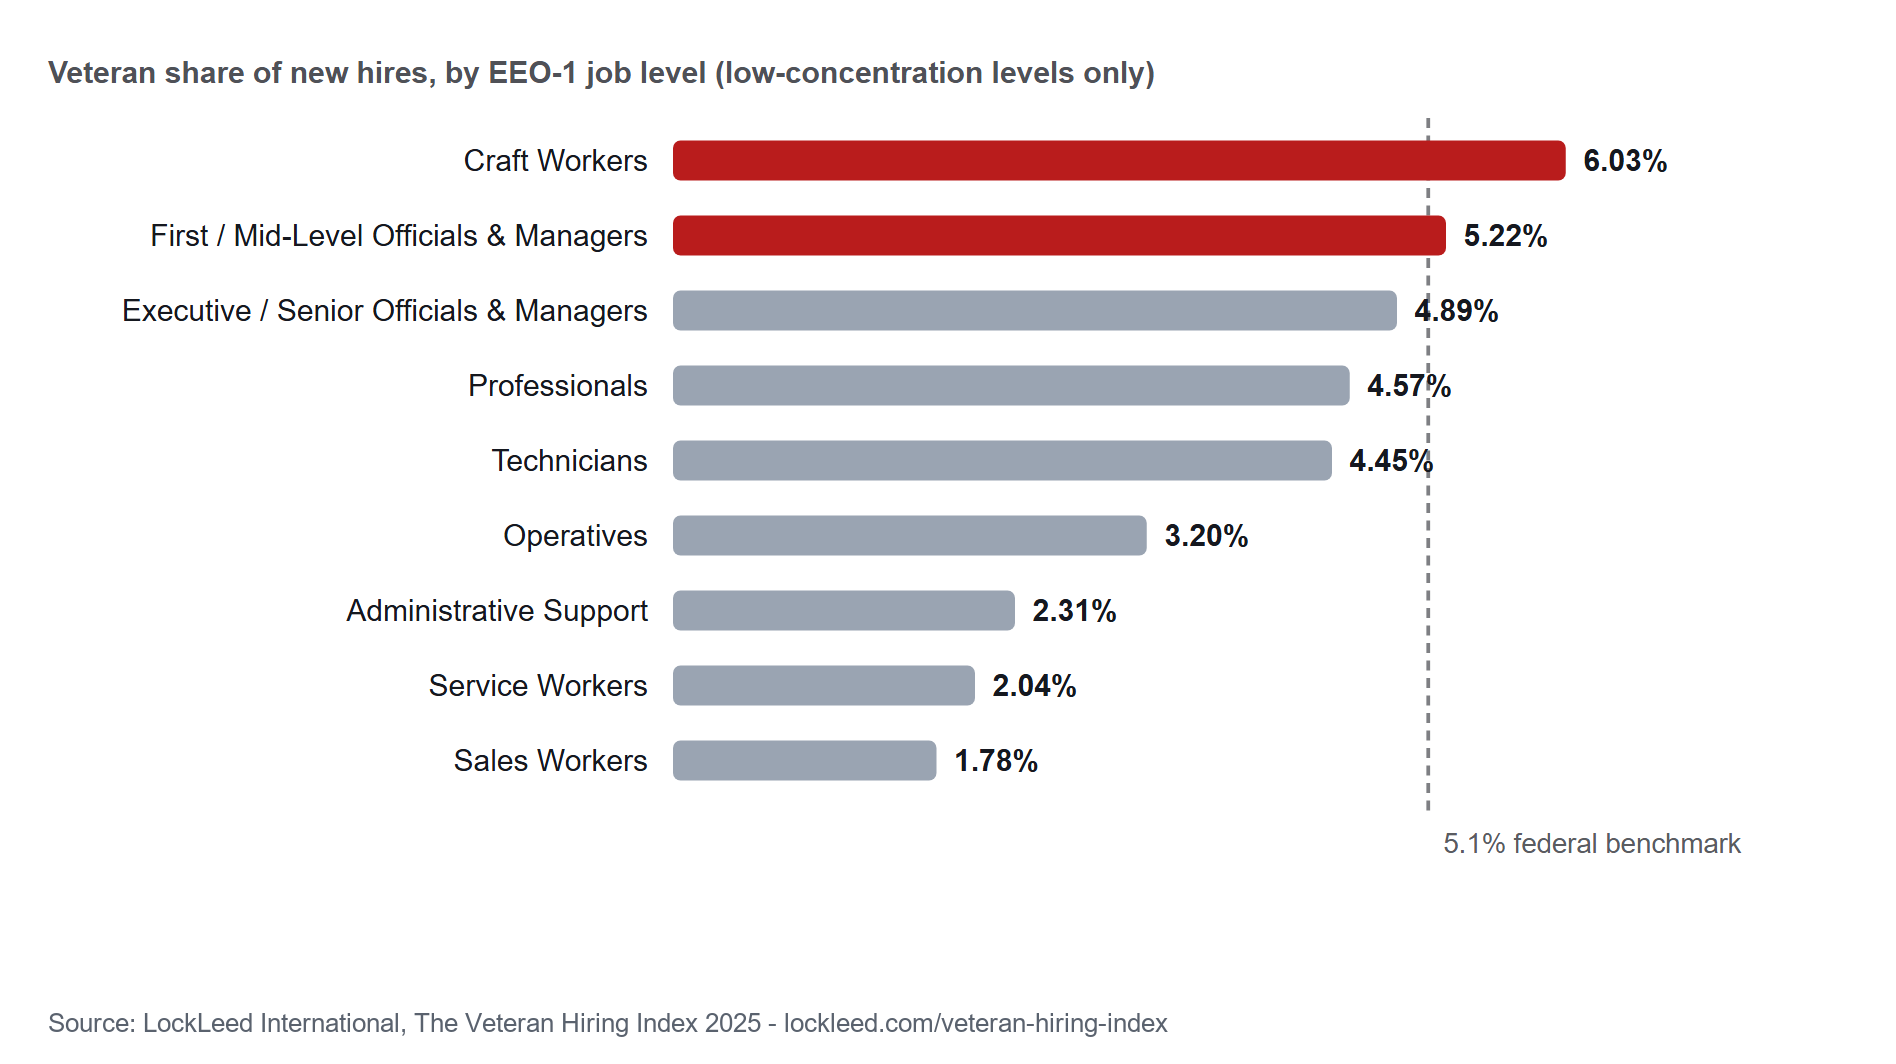
The question behind the industry table is really an occupational one: what kind of jobs do veterans actually get hired into? The filings answer it — every report breaks hires into the ten EEO-1 job categories.
The stereotype fails in the data. The only job level where federal contractors hire veterans above the 5.1% benchmark is skilled craft work, with first- and mid-level management just behind — while the lowest veteran hire rate of any level is in laborer and helper roles. Veterans are hired into the trades at roughly three and a half times the rate they are hired as laborers.
| Job level (EEO-1 category) | Veteran share of new hires | New hires | Employers |
|---|---|---|---|
| Craft Workers | 6.03% | 435,383 | 5,165 |
| First / Mid-Level Officials & Managers | 5.22% | 342,258 | 10,032 |
| Executive / Senior Officials & Managers | 4.89% | 33,393 | 6,003 |
| Professionals | 4.57% | 1,529,485 | 12,352 |
| Technicians | 4.45% | 438,490 | 6,773 |
| Operatives | 3.20% | 837,249 | 4,884 |
| Administrative Support | 2.31% | 902,466 | 10,832 |
| Service Workers | 2.04% | 1,347,171 | 3,073 |
| Sales Workers | 1.78% | 651,093 | 4,897 |
| Laborers & Helpers 73% concentrated | 1.68% | 1,930,614 | 4,732 |
Laborers & Helpers is flagged because three filers account for 73% of every laborer hire in the data — that row describes those companies, not a labor market. Each rate is self-contained: veteran hires in that category divided by all hires in that category, so category rows do not depend on filings adding up across categories.
The trend: five filing cycles
With five final filing cycles now computed through identical code, the Index can say something a single year cannot. Two findings:
First, no progress. From 2021 through 2024 the veteran share of new hires stayed inside a narrow band (3.35% to 3.65%), and in 2025 it fell to 2.97%, the lowest of the five. Roughly three-quarters of hiring establishments recorded zero veteran hires in every single cycle. The gap to the 5.1% benchmark is not closing on its own.
Second, the peak is behind us. To separate real behavior from changes in who files, we also track a matched cohort: the 5,799 companies that filed and hired in all five cycles. Holding the population constant, veteran hiring peaked in the 2023 cycle at 4.12% and has declined since. Both lines move together, so the trend is behavior, not filer churn.
| Filing cycle | All filers | Matched cohort | Total new hires | Status |
|---|---|---|---|---|
| 2021 | 3.55% | 3.27% | 6,941,074 | final |
| 2022 | 3.35% | 3.59% | 9,351,050 | final |
| 2023 | 3.65% | 4.12% | 9,452,334 | final |
| 2024 | 3.52% | 3.78% | 8,641,232 | final |
| 2025 | 2.97% | 3.02% | 8,630,023 | final |
The 2025 cycle closed on September 30, 2025. DOL counts late reports toward whichever cycle is open when they arrive, so these figures will not change. The 2021 cycle carries pandemic-era hiring volumes (the cohort hired 26% fewer people than in 2022), which depresses confidence in that single point. The flat-to-declining reading holds with or without it.
Why there is no state ranking
We built one, checked it, and threw it away. The state field in a VETS-4212 filing is the filer's headquarters, not the location where the hiring happened. A ranking built on it measures where large companies keep their head office, not where veterans get hired. In our working version, 77% of “Rhode Island” hires were CVS Health, 61% of “Minnesota” were UnitedHealthcare, and 81% of “Washington” were Amazon.
Publishing that would have produced a clean, shareable, completely false map. Until an establishment-level location field is available, there is no state cut on this page.
Methodology
- Source. VETS-4212 filings for the 2025 cycle, published by the U.S. Department of Labor: 422,692 establishment records covering 20,382 distinct employers.
- Rate definition. Veteran share of new hires = protected-veteran new hires divided by total new hires. The workforce rate uses total employees on the same basis.
- The unit is an establishment, not a company. A large employer files once per hiring location and so appears many times. Aggregate rates are unaffected (they are sums), but any count of establishments is not a count of companies.
- Median establishment is computed only over locations with 20 or more hires, so a site that hired three people cannot swing it to 0% or 33%.
- Industries are 2-digit NAICS sectors taken from the filing. Sectors with fewer than 50,000 total hires are omitted as too thin to report.
- Concentration is the share of a sector's hires belonging to its three largest filers. Above 40% the sector is flagged and excluded from the chart.
- Job levels are the ten EEO-1 categories as filed. The column-to-label mapping was verified against DOL's own batch-file specification (fields 48–69 of the electronic submission layout) rather than third-party summaries, which disagree on the ordering. Per-level rates are computed independently per category.
- Benchmark. 5.1% is the OFCCP national veteran hiring benchmark. Falling below it is not a violation — it is a signal to document and improve outreach. The benchmark also applies per establishment, not company-wide.
- Trend construction. All five cycles, 2021 to 2025, are final and computed by the same code. The matched cohort holds the population constant — only companies that filed and hired in all five cycles — so the trend line cannot be an artifact of who entered or left the dataset.
- Known limitations. Self-identification is voluntary and understates veteran counts; filings are self-reported and not audited here; and the 2021 cycle reflects pandemic-era hiring volumes.
Get the data — and cite it
Free to use with attribution to LockLeed International. If you are writing about this and want a cut we have not published, ask — we would rather you quote the right number.
- Industry table (CSV)
- Full dataset (JSON)
- Industry chart (PNG, embeddable with credit)
- Job-level table (CSV)
- Job-level chart (PNG, embeddable with credit)
- Five-cycle trend, all filers + matched cohort (CSV)
Citing this research
LockLeed International, “The Veteran Hiring Index 2025,” analysis of 422,692 U.S. Department of Labor VETS-4212 filings. lockleed.com/veteran-hiring-index
Writing about this? Media contact: [email protected] · 763-355-5789. We can turn a custom cut around quickly, and we would rather help than see a number misread.
If your own numbers are below the benchmark, that is the common case, not a scandal — 72.5% of employers we measured are in the same position. You can look up your own filed rate in a few seconds, and read what a shortfall actually obliges you to do.